Web server |
Installation |
Command-line |
Output |
The MutPred2 web server
The input data should be in the standard FASTA format with the substitutions specified in each sequence's header, delimited by spaces (no commas or semi-colons). The sequence ID can be of any format so long as it does not contain a space, a semi-colon or a comma. An example is provided below. In the first record, the header begins with a > followed by the sequence ID: NP_057295|SEC31A. There are three substitutions for this sequence: P changing to T at position 775, P changing to S at position 764, and P changing to Q at position 764. The web server allows for predictions on 100 amino acid substitutions (the number of sequences does not matter). Every protein sequence must be of length >30 and <30,000 residues. Note that computation time is proportional to the length of a sequence and the number of substitutions.
>NP_057295|SEC31A P775T P764S P764Q
MKLKEVDRTAMQAWSPAQNHPIYLATGTSAQQLDATFSTNASLEIFELDLSDPSLDMKSCATFSSSHRYHKLIWGPYKMDSKGDVSGVLIAGGENGNII
LYDPSKIIAGDKEVVIAQNDKHTGPVRALDVNIFQTNLVASGANESEIYIWDLNNFATPMTPGAKTQPPEDISCIAWNRQVQHILASASPSGRATVWDL
RKNEPIIKVSDHSNRMHCSGLAWHPDVATQMVLASEDDRLPVIQMWDLRFASSPLRVLENHARGILAIAWSMADPELLLSCGKDAKILCSNPNTGEVLY
ELPTNTQWCFDIQWCPRNPAVLSAASFDGRISVYSIMGGSTDGLRQKQVDKLSSSFGNLDPFGTGQPLPPLQIPQQTAQHSIVLPLKKPPKWIRRPVGA
SFSFGGKLVTFENVRMPSHQGAEQQQQQHHVFISQVVTEKEFLSRSDQLQQAVQSQGFINYCQKKIDASQTEFEKNVWSFLKVNFEDDSRGKYLELLGY
RKEDLGKKHIKEEKEESEFLPSSGGTFNISVSGDIDGLITQALLTGNFESAVDLCLHDNRMADAIILAIAGGQELLARTQKKYFAKSQSKITRLITAVV
MKNWKEIVESCDLKNWREALAAVLTYAKPDEFSALCDLLGTRLENEGDSLLQTQACLCYICAGNVEKLVACWTKAQDGSHPLSLQDLIEKVVILRKAVQ
LTQAMDTSTVGVLLAAKMSQYANLLAAQGSIAAALAFLPDNTNQPNIMQLRDRLCRAQGEPVAGHESPKIPYEKQQLPKGRPGPVAGHHQMPRVQTQQY
YPHGENPPPPGFIMHGNVNPNAAGQLPTSPGHMHTQVPPYPQPQPYQPAQPYPFGTGGSAMYRPQQPVAPPTSNAYPNTPYISSASSYTGQSQLYAAQH
QASSPTSSPATSFPPPPSSGASFQHGGPGAPPSSSAYALPPGTTGTLPAASELPASQRTGPQNGWNDPPALNRVPKKKKMPENFMPPVPITSPIMNPLG
DPQSQMLQQQPSAPVPLSSQSSFPQPHLPGGQPFHGVQQPLGQTGMPPSFSKPNIEGAPGAPIGNTFQHVQSLPTKKITKKPIPDEHLILKTTFEDLIQ
RCLSSATDPQTKRKLDDASKRLEFLYDKLREQTLSPTITSGLHNIARSIETRNYSEGLTMHTHIVSTSNFSETSAFMPVLKVVLTQANKLGV
>NP_006588|HSPA8 Q473R T429S
MSKGPAVGIDLGTTYSCVGVFQHGKVEIIANDQGNRTTPSYVAFTDTERLIGDAAKNQVAMNPTNTVFDAKRLIGRRFDDAVVQSDMKHWPFMVVNDAG
RPKVQVEYKGETKSFYPEEVSSMVLTKMKEIAEAYLGKTVTNAVVTVPAYFNDSQRQATKDAGTIAGLNVLRIINEPTAAAIAYGLDKKVGAERNVLIF
DLGGGTFDVSILTIEDGIFEVKSTAGDTHLGGEDFDNRMVNHFIAEFKRKHKKDISENKRAVRRLRTACERAKRTLSSSTQASIEIDSLYEGIDFYTSI
TRARFEELNADLFRGTLDPVEKALRDAKLDKSQIHDIVLVGGSTRIPKIQKLLQDFFNGKELNKSINPDEAVAYGAAVQAAILSGDKSENVQDLLLLDV
TPLSLGIETAGGVMTVLIKRNTTIPTKQTQTFTTYSDNQPGVLIQVYEGERAMTKDNNLLGKFELTGIPPAPRGVPQIEVTFDIDANGILNVSAVDKST
GKENKITITNDKGRLSKEDIERMVQEAEKYKAEDEKQRDKVSSKNSLESYAFNMKATVEDEKLQGKINDEDKQKILDKCNEIINWLDKNQTAEKEEFEH
QQKELEKVCNPIITKLYQSAGGMPGGMPGGFPGGGAPPSGGASSGPTIEEVD
>NP_000028|ANK1 S597R
MPYSVGFREADAATSFLRAARSGNLDKALDHLRNGVDINTCNQNGLNGLHLASKEGHVKMVVELLHKEIILETTTKKGNTALHIAALAGQDEVVRELVN
YGANVNAQSQKGFTPLYMAAQENHLEVVKFLLENGANQNVATEDGFTPLAVALQQGHENVVAHLINYGTKGKVRLPALHIAARNDDTRTAAVLLQNDPN
PDVLSKTGFTPLHIAAHYENLNVAQLLLNRGASVNFTPQNGITPLHIASRRGNVIMVRLLLDRGAQIETKTKDELTPLHCAARNGHVRISEILLDHGAP
IQAKTKNGLSPIHMAAQGDHLDCVRLLLQYDAEIDDITLDHLTPLHVAAHCGHHRVAKVLLDKGAKPNSRALNGFTPLHIACKKNHVRVMELLLKTGAS
IDAVTESGLTPLHVASFMGHLPIVKNLLQRGASPNVSNVKVETPLHMAARAGHTEVAKYLLQNKAKVNAKAKDDQTPLHCAARIGHTNMVKLLLENNAN
PNLATTAGHTPLHIAAREGHVETVLALLEKEASQACMTKKGFTPLHVAAKYGKVRVAELLLERDAHPNAAGKNGLTPLHVAVHHNNLDIVKLLLPRGGS
PHSPAWNGYTPLHIAAKQNQVEVARSLLQYGGSANAESVQGVTPLHLAAQEGHAEMVALLLSKQANGNLGNKSGLTPLHLVAQEGHVPVADVLIKHGVM
VDATTRMGYTPLHVASHYGNIKLVKFLLQHQADVNAKTKLGYSPLHQAAQQGHTDIVTLLLKNGASPNEVSSDGTTPLAIAKRLGYISVTDVLKVVTDE
TSFVLVSDKHRMSFPETVDEILDVSEDEGEELISFKAERRDSRDVDEEKELLDFVPKLDQVVESPAIPRIPCAMPETVVIRSEEQEQASKEYDEDSLIP
SSPATETSDNISPVASPVHTGFLVSFMVDARGGSMRGSRHNGLRVVIPPRTCAAPTRITCRLVKPQKLSTPPPLAEEEGLASRIIALGPTGAQFLSPVI
VEIPHFASHGRGDRELVVLRSENGSVWKEHRSRYGESYLDQILNGMDEELGSLEELEKKRVCRIITTDFPLYFVIMSRLCQDYDTIGPEGGSLKSKLVP
LVQATFPENAVTKRVKLALQAQPVPDELVTKLLGNQATFSPIVTVEPRRRKFHRPIGLRIPLPPSWTDNPRDSGEGDTTSLRLLCSVIGGTDQAQWEDI
TGTTKLVYANECANFTTNVSARFWLSDCPRTAEAVNFATLLYKELTAVPYMAKFVIFAKMNDPREGRLRCYCMTDDKVDKTLEQHENFVEVARSRDIEV
LEGMSLFAELSGNLVPVKKAAQQRSFHFQSFRENRLAMPVKVRDSSREPGGSLSFLRKAMKYEDTQHILCHLNITMPPCAKGSGAEDRRRTPTPLALRY
SILSESTPGSLSGTEQAEMKMAVISEHLGLSWAELARELQFSVEDINRIRVENPNSLLEQSVALLNLWVIREGQNANMENLYTALQSIDRGEIVNMLEG
SGRQSRNLKPDRRHTDRDYSLSPSQMNGYSSLQDELLSPASLGCALSSPLRADQYWNEVAVLDAIPLAATEHDTMLEMSDMQVWSAGLTPSLVTAEDSS
LECSKAEDSDATGHEWKLEGALSEEPRGPELGSLELVEDDTVDSDATNGLIDLLEQEEGQRSEEKLPGSKRQDDATGAGQDSENEVSLVSGHQRGQARI
THSPTVSQVTERSQDRLQDWDADGSIVSYLQDAAQGSWQEEVTQGPHSFQGTSTMTEGLEPGGSQEYEKVLVSVSEHTWTEQPEAESSQADRDRRQQGQ
EEQVQEAKNTFTQVVQGNEFQNIPGEQVTEEQFTDEQGNIVTKKIIRKVVRQIDLSSADAAQEHEEVELRGSGLQPDLIEGRKGAQIVKRASLKRGKQ
The other information that the web server asks for are an email address and a P-value threshold. Results from MutPred2 will be sent via email to the address provided. The P-value threshold determines the filtering criterion for displaying predicted molecular mechanisms (if set to a higher P-value, more mechanisms will be shown in the output). For more information on interpreting MutPred2 predictions, see below.
Installing MutPred2
1. After downloading the tarball package, unpack it:
tar -xzvf mutpred2.0.tar.gz
2. PSI-BLAST is provided along with MutPred2 and needs to be told where the BLOSUM62 matrix file is. If you already have a legacy version of BLAST installed, it will probably find the file on your machine. In that case, jump directly to step 3. Otherwise, open a file called .ncbirc in your home directory. If it does not exist, create one. Add/modify the following lines to point PSI-BLAST to the data sub-directory.
[NCBI]
   DATA=<PATH_TO_MUTPRED2>/mutpred2.0/blast-2.2.18/data/
3. Either log out of the session and log back in or run source on .ncbirc (ignore the subsequent error message):
source .ncbirc
   -bash: [NCBI]: command not found
4. If need be, you can add the mutpred2.0 directory to your bash profile. For instructions, see here.
Moving installed files/directories: when moving files, make sure that the entire directory structure is moved together. The exception to this is the MATLAB Compiler Runtime (MCR) sub-directory (called v91). This can be moved as long as the appropriate change is made to the run_mutpred2.sh script. Simply change the directory path in the following line to wherever v91 is moved:
MCRROOT="$exe_dir/v91";
Alternatively, if you have MATLAB-R2016b installed or the MCR (version 9.1) already available, you can just edit this line to point to the location of the MCR on your machine and delete this directory to save space.
Note for experienced MATLAB users: if you already have been using MATLAB and have MATLAB_USE_USERWORK=1 in your .bashrc file, MutPred2 might run into some issues. To prevent any error messages due to this, unset this variable.
Running MutPred2
The actual shell script that runs MutPred2 is called run_mutpred2.sh. The input format is the same as that for the web application (except that a semi-colon in a header is acceptable). Alternatively, the output file from ANNOVAR's coding_change.pl program can also be input. MutPred2 can be run using the following command:
<PATH_TO_MUTPRED2>/mutpred2.0/run_mutpred2.sh -i test.faa -p 1 -c 1 -b 0 -t 0.1 -f 1 -o test.out
Command-line arguments: all argument information can be displayed by simply typing run_mutpred2.sh without any command-line arguments.
run_mutpred2.sh
   USAGE: mutpred2 arguments (see below)
	-i	<FASTA file name (String)>			Substitutions must be in headers, delimited by space
	-o	[Output file name (String)]			Defaults to the standard output
	-p	[Use model with homology profiles (0 or 1)]	If 0 (default), no human and mouse proteome homolog
								counts are computed
								If 1, these counts are computed (much slower but more
								accurate)
	-c	[Predict conservation features (0 or 1)]		If 0, for substitutions from proteins where conservation
								scores are not available, these features are marked as
								zeros
								If 1 (default), predicted conservation scores are used
								(more accurate than not using conservation features but
								less accurate than using known conservation scores)
	-b	[Skip PSI-BLAST (0 or 1)]			If 0 (default and also when "-c" is 1), in cases where
								precomputed PSSMs are not available, PSI-BLAST is run
								If 1, they are treated as missing features (much faster
								but scores not as reliable for such proteins)
	-f	[Output file format]				If 1 (default), loss/gain of structural and functional
								properties are output in both row and ontological format
								If 2, loss/gain of structural and functional properties
								are output in row format only
								If 3, loss/gain of structural and functional properties
								are output in ontological format only
								If 4, only MutPred2 general pathogenicity scores are
								output (smaller output file)
	-t	[P-value threshold (>= 0 and <= 1)]		Show only those mechanisms with P-value < this value
    							        (default: 0.05; for Bonferroni correction, set "t" to
    							        0.0009)
Interpreting the results
The output of MutPred2 consists of a general score (g), i.e., the probability that the amino acid substitution is pathogenic. This score is the average of the scores from all neural networks in MutPred2. If interpreted as a probability, a score threshold of 0.50 would suggest pathogenicity. However, in our evaluations, we have estimated that a threshold of 0.68 yields a false positive rate (fpr) of 10% and that of 0.80 yields an fpr of 5%.
MutPred2 also outputs property scores that reflect the impact of a substitution on different properties in two related ways:
1. The posterior probability of the loss/gain of certain structural and functional properties due to the substitution (Pr) is provided. Since these are true posterior probabilities, they can be compared across properties and serve as a means of ranking putatively impacted properties, i.e., the output of MutPred2 ranks molecular mechanisms in descending order of Pr. It is important to note that loss or gain should be interpreted as decreased or increased propensity for a certain property to occur in the region (-5 to +5 residues) of the substitution. In the case of certain properties, a single-residue change can result in effects in both directions, thus, complicating interpretation. For instance, a substitution can increase a protein’s propensity to bind one protein partner but decrease its propensity for another. For simplicity, the term altered is used for such properties (instead of loss or gain) and the maximum of the loss and gain score is reported.
2. An empirical P-value (P) calculated as the fraction of benign substitutions in MutPred2's training set with Pr values >= to the Pr value for the given substitution. A P-value threshold of 0.05 means that, under the null hypothesis, we expect 5% of benign substitutions to impact the particular property to the extent that the given substitution does. These P-values are specific to each property, and therefore, two properties with the same Pr need not have the same P-value.
Assuming that the probability that a particular residue has a propensity for a certain property is 0.5 and that the substitution does not impact this propensity (the mutated residue also yields a probability of 0.5), the posterior probability of impact is 0.5 x (1 - 0.5) = 0.25. This serves as a reasonable operating threshold, above which the disruption of a property could be implicated as a molecular mechanism of pathogenicity. Even when scores are lower than this value, it is recommended to make follow-up decisions based on the ranking and the associated P-values.
The output file format is explained below:
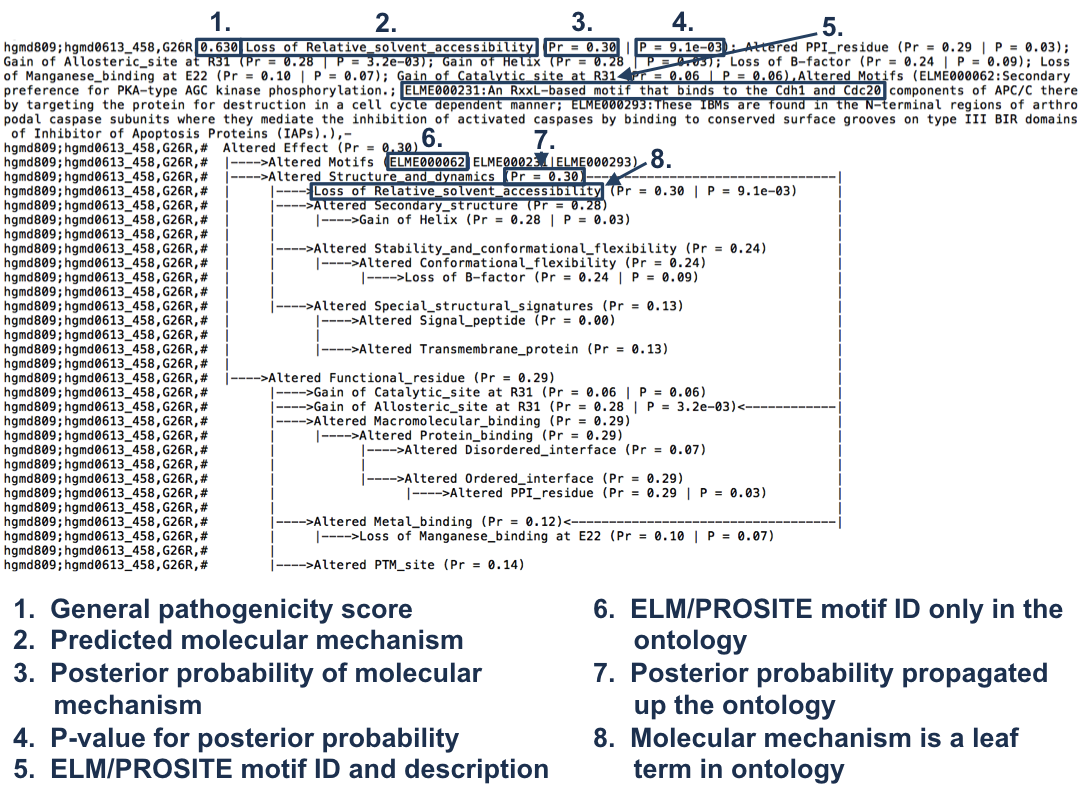
Differences between the outputs of the web server and the standalone versions: Unlike the standalone software's output file, the web server version displays molecular mechanisms only for the substitutions with g >= 0.5. The other major difference is that the web server output format ignores the ontology structure and only displays scores for the leaf terms as a ranked list.
 |
 |